
Effects of financing on ROE | ROE vs EBIT
This following analysis is couched in terms relevant to a privately held company and is, therefore, less complex than it would be for a company with public equity. The presentation thus emphasizes the effects of financing on the return on equity (ROE) rather than on earnings per share.
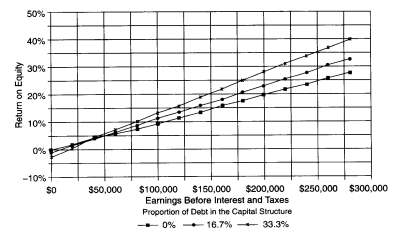
The above chart displays the relationship between Return on Equity and Earnings before Interest and Taxes. With 100 percent equity financing, the ROE at the current $120,000 EBIT level is 12 percent. If the business flourishes without requiring additional assets and investment, the ROE rises. At an EBIT of $180,000, the ROE is 18 percent. If the business encounters problems, however, and EBIT falls by one-half to $60,000, the ROE drops to 6 percent. The change in the ROE reflects perfectly the proportionate change in EBIT.
If the entrepreneur elected more aggressive financing, borrowing a third of the needed capital, net profits drop because of the greater interest charges. If the EBIT is $120,000, the ROE will be 16.2 percent. The decrease in the equity the entrepreneur must provide more than offsets the additional interest. If the business thrives with EBIT rising to $180,000, the ROE goes to 25.2 percent,7 percentage points higher than with all-equity financing.
If EBIT drops, however, the ROE drops much faster under the debt-financed purchase than with the all-equity proposition. With an EBIT of only $60,000, the ROE drops to 7 percent. To break even, EBIT must be at least the cost of interest, $6,000, with the debt financing. With the equity financing, Company X’s would still be showing a profit, but a small one, at an EBIT of $6,000.
The relationship between EBIT and ROE is linear, as shown in the above image. A given change in EBIT produces a constant change in ROE. This can be easily seen in the all-equity case. An increase of $20,000 Company X’s EBIT at any EBIT level creates an increase of 2 percent (not 2 percentage points) in ROE. The calculation is based on the income statement.
ROE equals: (EBIT — (interest rate x debt)) x (I — tax rate) / Equity
In the all-equity case, the debt in the numerator would be zero and the equity in the denominator would be equal to the enterprise’s capital. For a given financing alternative, the only change is in the EBIT. Thus, ($20,000 x [I — .4] x $600,000) = 2 percent.
The same formula is used to calculate the linear relationships for the other two alternatives as well. For example, if Company X is financed with 16.7 percent debt in its capital structure, the ROE will change 2.4 percent for each $20,000 change in EBIT. At a 33 percent debt structure, the change is 3 percent for each $20,000 EBIT change.
What is an advantage when EBIT rises is a disadvantage when it falls. ROE declines much more quickly when a capital structure is levered with debt. If EBIT falls low enough, the ROE is better with the all-equity financing. The cross-over EBIT is the point at which the before-tax return on capital (EBIT / (debt + equity) equals the interest rate on the debt. Above that point, the borrowed funds are earning more than their cost. The difference in earnings enhances the ROE. Below that EBIT, earnings on the equity base are helping pay interest on the borrowed funds: the ROE is being eroded to pay the interest. The crossover between the ROEs of the three alternatives for Company X occurs at an EBIT of $36,000 ($36,000 / $600,000 = 6 percent).
IMPORTANT: A chart such as the above by itself, is not a magic device that tells the entrepreneur what capital decision to make. It does help the analysis by showing relative rates of change, positions, and points of relative attractiveness.
This analytical approach is also valid once the entrepreneur has purchased the business and is considering an investment to expand it. The entrepreneur can invest enough additional equity to pay for the entire cost of the investment. Or, the entrepreneur can finance some or all of the investment with borrowed funds. The use of borrowed funds will have the effect of increasing the ROE if all goes well.
FINANCIAL MANAGEMENT: To maintain the beneficial effects of leverage on the ROE, the debt proportion must be maintained.
If funds are used to reduce the debt level over time, the ROE will gradually drop back to what it would have been if equity had been used in the first place — in effect, dropping from a higher line in the above chart to a lower one. Because remortgaging can be expensive, for example, the debt level is often adjusted when new assets are acquired. If the proportion of equity has built up, the new asset can often be financed with a higher percentage of debt (perhaps even purchased entirely with debt) than the company’s average. This action will raise the company’s leverage toward or even past the target level.
Because of this financing practice, many companies show a saw-tooth pattern in their capital structure. Debt is taken on temporarily in a proportion above the level the entrepreneur considers acceptable. It is then gradually reduced, often falling below the target capital structure before an opportunity occurs to re-leverage.
KEY POINT: Given this pattern, the initial boost in the ROE provided by a high proportion df debt financing will gradually decline as the capital structure reverts to the target levels. The entrepreneur should thus always ask whether the higher leverage will produce enough gain in the short run to justify the risks associated with it. If it does not, then a less aggressive financing mix will produce almost the same results in the end with less risk in the interim.
